mixOmics is an R package for exploring and integrating omics data, including transcriptomics, proteomics, lipidomics, microbiome, metagenomics and beyond. The mixOmics package includes tools for data integration, biomarker discovery, and data visualisation, using advanced multivariate methods to reduce data dimensionality and uncover relationships within and across datasets.
mixOmics offers a wide range of multivariate methods for the exploration and integration of biological datasets, with a specific focus on variable selection.
Multivariate methods for Omics data
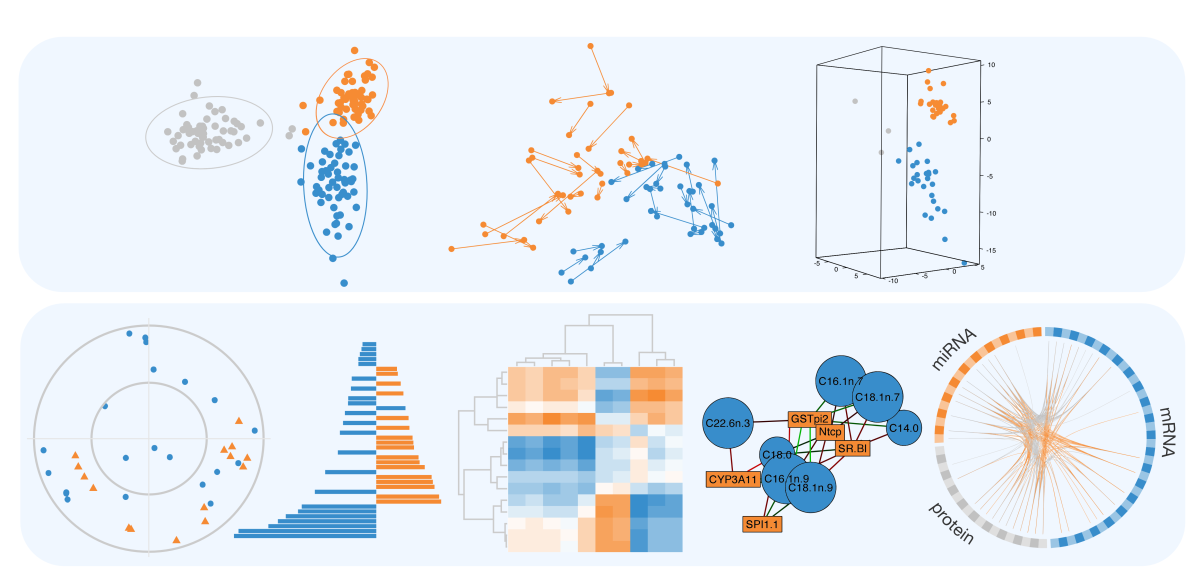
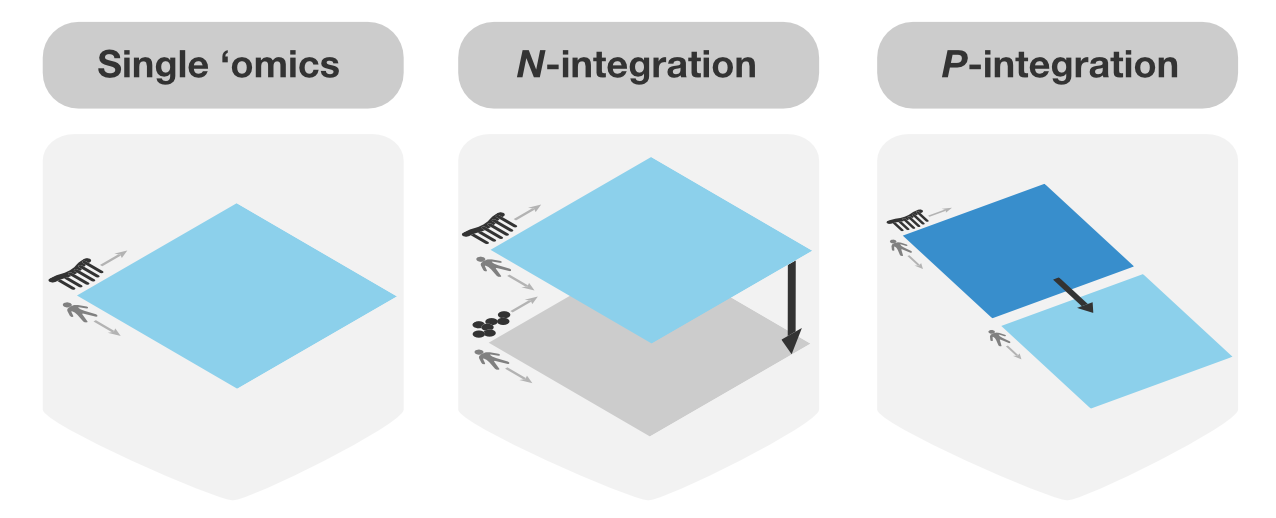
Multivariate methods are well suited for large omics datasets with many variables (e.g., genes, proteins) and few samples (e.g., patients, cells). They reduce data dimensionality by creating components—combinations of variables—that reveal patterns and relationships between omics datasets. These components can be used to produce clear visualisations, uncover key variables linked to biological outcomes and integrate multi-omics datasets. Our sparse multivariate models can be used to identify the key variables that are highly correlated or explain the biological outcome of interest (e.g. disease status).
The mixOmics project
The mixOmics R toolkit aims to bridge the gap between complex statistical methods and practical applications in biological and biomedical research, making advanced data analysis accessible to a diverse range of users, from statisticians to biologists. The mixOmics team is led by Prof. Kim-Anh Lê Cao at the University of Melbourne and includes contributors from around the world.
If you use mixOmics in your research, do not forget to cite us!
Consider also supporting the ongoing development of mixOmics by purchasing our book, or joining our workshops!