These two recordings were part of a presentation to WEHI for their postgraduate lecture series for a diverse audience.
In the PCA presentation (18 min), we explain the concept of linear combination of variables (components) and useful graphical outputs such as correlation circle plots and biplots.
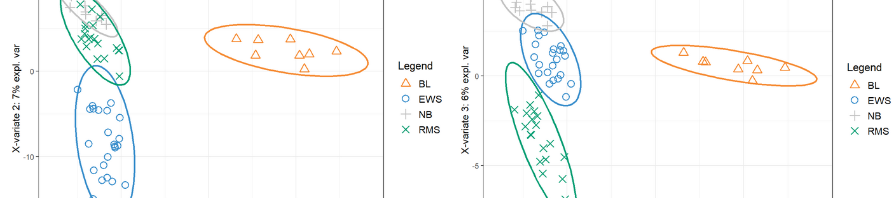
In the PLS-DA presentation (7 min), we talk about the concept of multivariate signature.
If you want to know more about the actual algorithm under the hood, you can watch this webinar on PLS.